ACORD Report Reveals Nearly 50% of Top 100 P/C Insurers Are Destroying Value

A recent analysis from ACORD reveals that “sustainable value creators” among the 100 largest property/casualty insurance carriers generated more than twice as much value through underwriting compared to investment activities over a 20-year study period.
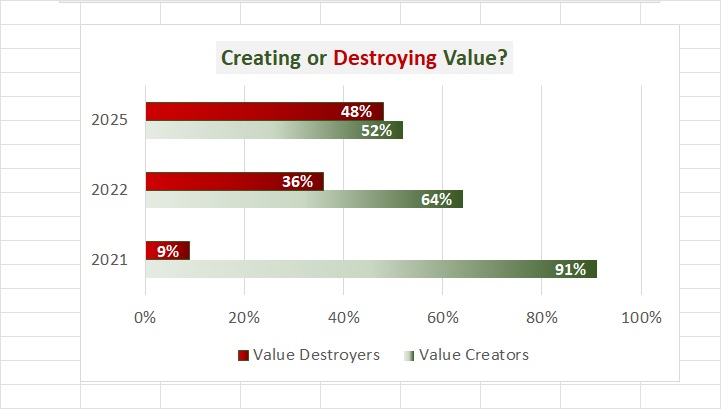
In a notable shift from previous ACORD studies, nearly half (48) of the 100 insurers were identified as value destroyers, as highlighted in ACORD’s “2025 U.S. Property & Casualty Value Creation Study.”
Three years ago, ACORD reported that just over one-third (36) of the largest insurers were value destroyers. In a comparable study from 2021, only 9 out of 100 fell into this category.
ACORD’s 2025 study, released in mid-December last year, continues to categorize insurers as value creators or destroyers based on whether their 20-year returns exceeded a specific benchmark. Creators surpassed the benchmark, while destroyers did not. The study measured cash flow exceeding an 8.2% cost of capital as the value metric.
The analysis distinguishes between two types of value creators: sustainable value creators, who meet the return threshold through both underwriting and investment activities, and hollow value creators, who rely solely on investment returns without generating value from underwriting.
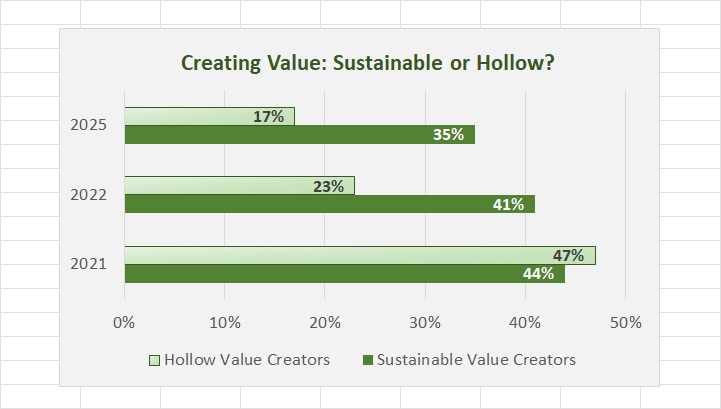
According to the latest study, 52% of companies were classified as value creators, with only 35% achieving sustainable value creation—yielding a 13.5% return on capital and generating $324 billion in value. These carriers created substantial value through underwriting, amounting to $229 billion, while also realizing $95 billion from investments.
Defining Value Creation
Markets will draw capital away from firms not achieving baseline minimum returns. Therefore, ACORD measured the amount of free cash flow generated through both underwriting and investments versus a minimum required capital charge. This required rate of return, which an investor could have achieved by investing in a diversified portfolio of investments, was represented by the returns of the S&P 500 over the 20-year period: 8.2 percent.
This year’s cost of capital is the highest measured in recent years.
ACORD analyzed 17 hollow value creators, noting that their underwriting operations consumed $85 billion of the $121 billion generated through investments, resulting in a net value creation of $36 billion. “Without their investment income, they would have fallen into the value destroyer category,” the report states, emphasizing the precarious position of these insurers.
Additional insights from ACORD’s research include:
• Larger carriers tend to generate more sustainable value in the U.S. P/C market. “More companies in the largest quartile [with net written premiums greater than $6 billion] achieved sustainable value creation, and fewer of them destroyed value, than any of the smaller quartiles.”
• Sustainable value creators maintain a balanced insurance portfolio, with approximately half in personal lines and half in commercial. In contrast, hollow value creators lean more towards commercial lines (56% commercial vs. 44% personal), while value destroyers emphasize personal lines (64% personal vs. 36% commercial).
• There is a notable difference in loss and loss adjustment expense ratios, with sustainable value creators averaging 70.2 compared to hollow creators at 73.9 and value destroyers at 75.3.
• On the underwriting expense side, sustainable value creators’ expense ratios averaged 24.3, nearly 7 points better than hollow creators (30.0) and over 3 points better than destroyers (27.4).
The ACORD report identifies key “value levers” that keep sustainable value creators ahead: underwriting, claims, and customer lifetime value. These carriers focus on profitable growth rather than merely expanding market share, leveraging data and advanced analytics, including AI, to target the right customers effectively.
In claims, technology acts as a “force multiplier” for human judgment, enhancing productivity and decision-making. Sustainable value creators also optimize customer lifetime value, averaging two products per customer, with some achieving five or more, compared to a 1.5 product average across the P/C personal lines industry.
For the first time, this year’s edition of the ACORD study is available to both members and non-members throughout the industry. Visit www.acord.org/research to download the report.
Topics
Carriers
Property Casualty
A recent analysis from ACORD reveals that “sustainable value creators” among the 100 largest property/casualty insurance carriers generated more than twice as much value through underwriting compared to investment activities over a 20-year study period.
In a notable shift from previous ACORD studies, nearly half (48) of the 100 insurers were identified as value destroyers, as highlighted in ACORD’s “2025 U.S. Property & Casualty Value Creation Study.”
Three years ago, ACORD reported that just over one-third (36) of the largest insurers were value destroyers. In a comparable study from 2021, only 9 out of 100 fell into this category.
ACORD’s 2025 study, released in mid-December last year, continues to categorize insurers as value creators or destroyers based on whether their 20-year returns exceeded a specific benchmark. Creators surpassed the benchmark, while destroyers did not. The study measured cash flow exceeding an 8.2% cost of capital as the value metric.
The analysis distinguishes between two types of value creators: sustainable value creators, who meet the return threshold through both underwriting and investment activities, and hollow value creators, who rely solely on investment returns without generating value from underwriting.
According to the latest study, 52% of companies were classified as value creators, with only 35% achieving sustainable value creation—yielding a 13.5% return on capital and generating $324 billion in value. These carriers created substantial value through underwriting, amounting to $229 billion, while also realizing $95 billion from investments.
Defining Value Creation
Markets will draw capital away from firms not achieving baseline minimum returns. Therefore, ACORD measured the amount of free cash flow generated through both underwriting and investments versus a minimum required capital charge. This required rate of return, which an investor could have achieved by investing in a diversified portfolio of investments, was represented by the returns of the S&P 500 over the 20-year period: 8.2 percent.
This year’s cost of capital is the highest measured in recent years.
ACORD analyzed 17 hollow value creators, noting that their underwriting operations consumed $85 billion of the $121 billion generated through investments, resulting in a net value creation of $36 billion. “Without their investment income, they would have fallen into the value destroyer category,” the report states, emphasizing the precarious position of these insurers.
Additional insights from ACORD’s research include:
• Larger carriers tend to generate more sustainable value in the U.S. P/C market. “More companies in the largest quartile [with net written premiums greater than $6 billion] achieved sustainable value creation, and fewer of them destroyed value, than any of the smaller quartiles.”
• Sustainable value creators maintain a balanced insurance portfolio, with approximately half in personal lines and half in commercial. In contrast, hollow value creators lean more towards commercial lines (56% commercial vs. 44% personal), while value destroyers emphasize personal lines (64% personal vs. 36% commercial).
• There is a notable difference in loss and loss adjustment expense ratios, with sustainable value creators averaging 70.2 compared to hollow creators at 73.9 and value destroyers at 75.3.
• On the underwriting expense side, sustainable value creators’ expense ratios averaged 24.3, nearly 7 points better than hollow creators (30.0) and over 3 points better than destroyers (27.4).
The ACORD report identifies key “value levers” that keep sustainable value creators ahead: underwriting, claims, and customer lifetime value. These carriers focus on profitable growth rather than merely expanding market share, leveraging data and advanced analytics, including AI, to target the right customers effectively.
In claims, technology acts as a “force multiplier” for human judgment, enhancing productivity and decision-making. Sustainable value creators also optimize customer lifetime value, averaging two products per customer, with some achieving five or more, compared to a 1.5 product average across the P/C personal lines industry.
For the first time, this year’s edition of the ACORD study is available to both members and non-members throughout the industry. Visit www.acord.org/research to download the report.
Topics
Carriers
Property Casualty